
Commercial Solar Financial Modeling Mistakes: The Unfiltered 2026 Reality for CA Property Owners

Most spreadsheets used to pitch solar in California right now are essentially works of fiction. They rely on national averages that have nothing to do with the reality of PG&E's 41.5¢/kWh average rates or the brutal impact of NEM 3.0 export credits. You've likely seen the overly optimistic ROI projections that ignore how demand charges actually behave. It's frustrating to be handed a proposal that feels more like a sales pitch than a rigorous financial audit. This article identifies the specific commercial solar financial modeling mistakes that kill ROI before your first panel is even installed. We'll show you how to move past flawed templates to build a bulletproof model. You'll learn to navigate the July 2026 ITC construction deadlines, accurately value battery energy storage systems, and finally see a clear path to reducing those volatile utility costs.
Key Takeaways
- National templates are a liability in California because they ignore the 75% drop in export credits under NEM 3.0. This guide identifies the specific commercial solar financial modeling mistakes that lead to inflated, unrealistic ROI expectations.
- Panels and batteries don't run at 100% capacity forever. We'll show you how to price in degradation and maintenance so your budget doesn't get blindsided by unexpected costs in five years.
- Avoided cost is the only metric that truly impacts your bottom line in 2026. Learn how to use battery storage to attack peak demand charges instead of just chasing low-value energy arbitrage.
- California utility rates are notoriously volatile. You'll learn how to stress-test your project against future rate hikes to ensure your long-term energy savings are actually predictable.
Table of Contents
- The Fallacy of Generic Spreadsheet Templates in California
- Miscalculating the 'Invisible' Costs of Commercial Solar & BESS
- Building a Model That Actually Predicts CA Cash Flow
The Fallacy of Generic Spreadsheet Templates in California
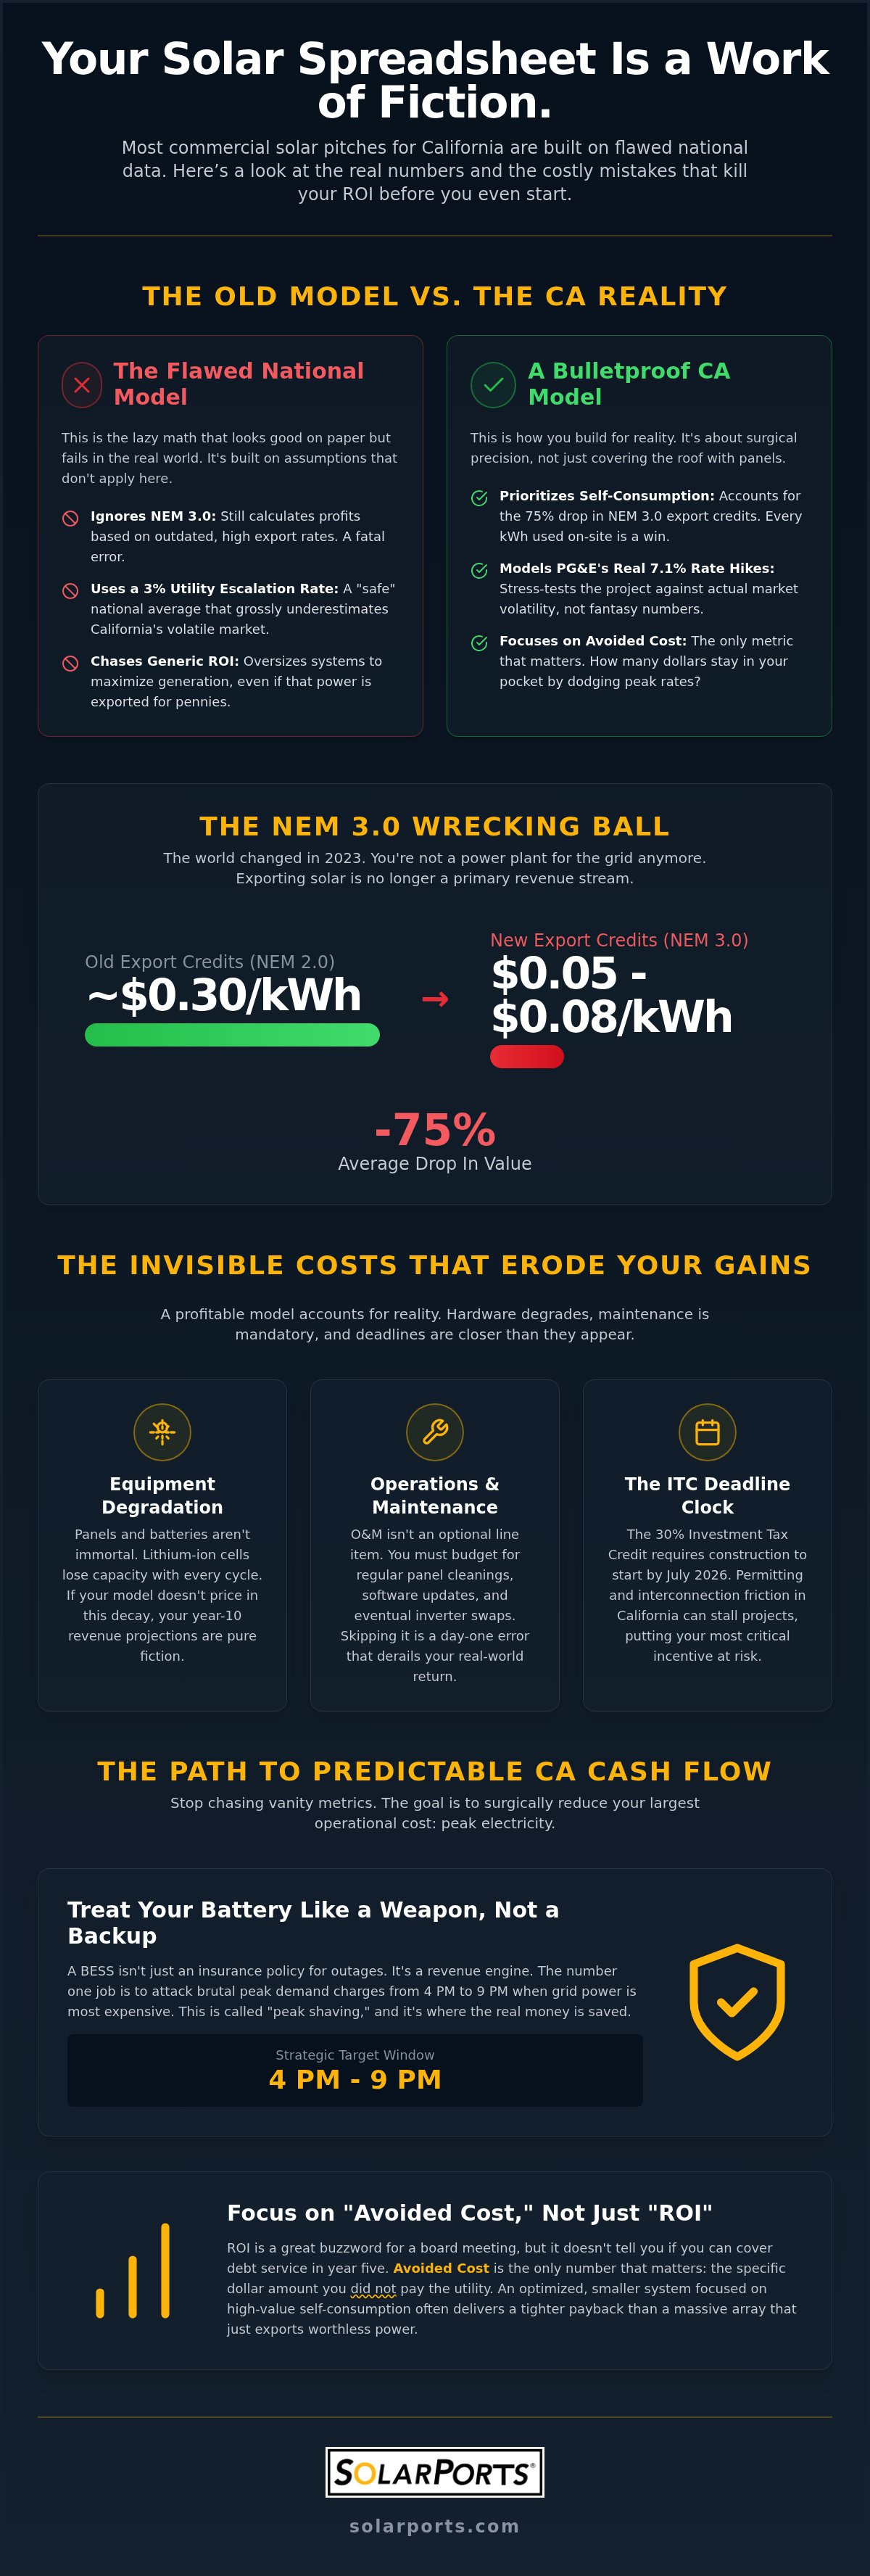
A generic national template is a liability. It assumes a linear world that doesn't exist here. Most installers still use a lazy 3% utility escalation rate because it makes the long-term ROI look safe and predictable. That's one of the most common commercial solar financial modeling mistakes. In reality, PG&E rates have climbed at an average of 7.1% annually, a stark increase that underscores the volatility of California's energy market. Using a national average in a state where power can cost 41.5¢/kWh is fiscal negligence. Static models fail because they treat electricity prices as a fixed constant rather than a moving target governed by complex, time-sensitive utility tariffs.
The NEM 3.0 and Demand Charge Blind Spot
The world changed in 2023, but many models are still stuck in 2022. Ignoring the shift to NEM 3.0 is one of the costliest commercial solar financial modeling mistakes a developer can make. Under the new tariff, export credits dropped by roughly 75%, averaging just $0.05 to $0.08 per kWh. You aren't getting paid to be a power plant for the grid anymore. Your financial model must prioritize self-consumption and aggressive demand charge mitigation. If your projection doesn't account for specific Time-of-Use (TOU) windows, you're just guessing. Success now depends on how you stack various financial incentives for solar against the actual cost of peak-hour power. Energy arbitrage, specifically using a battery to shift load away from 4 PM to 9 PM peaks, is the only way to make the numbers work. We focus on these granular details in our commercial property energy cost saving analysis to ensure your project survives the reality of the California grid.
Miscalculating the 'Invisible' Costs of Commercial Solar & BESS
Financial models often fail because they assume hardware is immortal. It isn't. One of the most frequent commercial solar financial modeling mistakes involves ignoring the non-linear degradation of Battery Energy Storage Systems (BESS). Lithium-ion cells lose capacity with every cycle. If your model doesn't account for this, your year-ten revenue projections are essentially fiction. Paper gains evaporate quickly when physical reality hits the roof.
Operations and maintenance (O&M) isn't an optional line item. It's a fundamental operational requirement. Skipping these costs is a day-one error that can derail your internal rate of return. You need to budget for regular panel cleanings and eventual inverter swaps. Then there's the "California tax" on your timeline. Permitting and interconnection fees are just the start; the real cost is the administrative friction that stalls your ability to claim the 30% ITC before the July 2026 construction deadline.
Modeling BESS: It's Not Just a Backup Generator
Don't treat a battery like an expensive insurance policy. It's a revenue engine. A common error is modeling BESS as a simple backup instead of a strategic tool for demand charge reduction. You have to balance aggressive peak-shaving against the battery's rated cycle life. Overworking the system to chase minor energy arbitrage gains today might kill the asset five years early. If you want to stop guessing the math, book a free energy cost saving analysis to audit your current projections against real-world performance data.
Building a Model That Actually Predicts CA Cash Flow
ROI is essentially a vanity metric. It looks great in a board meeting, but it doesn't tell you if you can actually cover the debt service in year five. The only number that matters for a California property owner is avoided cost. You need to know the specific dollar amount staying in your pocket by not purchasing power at those brutal peak rates. One of the most common commercial solar financial modeling mistakes is over-sizing the array just to maximize generation. Under the current rules, every excess kilowatt-hour you export is a missed opportunity for capital efficiency. An optimized, smaller system usually delivers a tighter payback by focusing on high-value self-consumption. It's about surgical precision, not just covering every square foot of the roof. This is the foundation of achieving turnkey commercial solar in CA.
Stress-testing is non-negotiable. Your model should account for the volatility of the market without relying on a flat, safe-looking escalation rate. If the math only works under perfect conditions, the project is a gamble, not an investment. You have to model for the worst-case scenario to ensure your cash flow remains positive even if utility tariffs shift again in the next decade.
From Static ROI to Dynamic Energy Cost Analysis
Monthly averages lie to you. They hide the spike in demand charges that happens when your HVAC kicks in at 3 PM. SolarPorts Development prioritizes 15-minute interval data because it is the only way to see the real-time interaction between your building's load and the solar output. This level of detail allows you to accurately integrate the 2026 Tax Credit into your long-term cash flow, ensuring you meet the critical construction deadlines. Don't base a multi-million dollar decision on a generic template. Get a model built on physical reality and schedule your consult today.
Protecting Your Bottom Line Against California's Energy Volatility
California's energy market doesn't forgive lazy math. Relying on outdated templates or ignoring the 75% drop in export credits under NEM 3.0 are common commercial solar financial modeling mistakes that turn a strategic asset into a fiscal drain. You need a model that accounts for real-world hardware degradation and the aggressive annual utility rate hikes typical of PG&E and SCE. We focus on data-driven right-sizing and turnkey BESS solutions to ensure your project delivers predictable cash flow. Don't let flawed spreadsheets dictate your capital expenditures. We're here to audit your existing projections and build a strategy grounded in utility reality. It's time to stop guessing and start measuring. You can secure your project's future today. Schedule a Free Commercial Solar Cost Analysis to lock in your 2026 savings.
Frequently Asked Questions
What is the most common mistake in commercial solar modeling?
The most frequent error is using a flat 3% utility escalation rate when California reality is much more aggressive. Most commercial solar financial modeling mistakes stem from these generic national assumptions. If your model doesn't account for the 7% to 9% annual hikes seen from utilities like PG&E or SCE, your long-term ROI is essentially built on a foundation of bad data.
How do California's NEM 3.0 rules affect my financial projections?
NEM 3.0 slashed export credits by roughly 75%, meaning you can't rely on the grid to buy your excess power at a premium anymore. Your projections must shift from simple generation to strategic self-consumption. The financial value now lives in using every kilowatt-hour on-site and attacking peak-demand charges rather than just counting total annual production numbers.
Can I model solar savings without battery storage in California?
You can, but it's rarely the most efficient move under current California tariffs. Without a battery, you're forced to export excess energy at avoided-cost rates as low as $0.05 per kWh. Integrating a battery allows for energy arbitrage; you can shift your solar power to the 4 PM to 9 PM peak window when utility costs are at their highest.
Why do solar quotes often overestimate the project's financial performance?
Many quotes ignore "invisible" costs like permitting friction or the physical degradation of the hardware over time. If a model doesn't include a dedicated budget for operations and maintenance or assumes panels perform at 100% for 25 years, the math is wrong. Common commercial solar financial modeling mistakes often involve skipping these operational realities just to make the payback period look more attractive on paper.
Frequently asked questions
What is the most common mistake in commercial solar modeling?
The most frequent error is using a flat 3% utility escalation rate when California reality is much more aggressive. Most commercial solar financial modeling mistakes stem from these generic national assumptions. If your model doesn't account for the 7% to 9% annual hikes seen from utilities like PG&E or SCE, your long-term ROI is essentially built on a foundation of bad data.
How do California's NEM 3.0 rules affect my financial projections?
NEM 3.0 slashed export credits by roughly 75%, meaning you can't rely on the grid to buy your excess power at a premium anymore. Your projections must shift from simple generation to strategic self-consumption. The financial value now lives in using every kilowatt-hour on-site and attacking peak-demand charges rather than just counting total annual production numbers.
Can I model solar savings without battery storage in California?
You can, but it's rarely the most efficient move under current California tariffs. Without a battery, you're forced to export excess energy at avoided-cost rates as low as $0.05 per kWh. Integrating a battery allows for energy arbitrage; you can shift your solar power to the 4 PM to 9 PM peak window when utility costs are at their highest.
Why do solar quotes often overestimate the project's financial performance?
Many quotes ignore "invisible" costs like permitting friction or the physical degradation of the hardware over time. If a model doesn't include a dedicated budget for operations and maintenance or assumes panels perform at 100% for 25 years, the math is wrong. Accurate commercial solar financial modeling mistakes often involve skipping these operational realities just to make the payback period look more attractive on paper.