Business Electricity Bill Analysis: The Unfiltered Reality of California Commercial Power Costs

Northern California businesses are operating in one of the most expensive power markets in the world, paying rates that dwarf the national average by over 100%. While PG&E implemented rate shifts in January 2026, the reality for many commercial properties was a 19% spike in non-bypassable charges that further muddied the bottom line. It's a system that thrives on complexity, leaving executive decision-makers with bills they pay but don't truly understand. A rigorous business electricity bill analysis is the first step in stripping away that opacity to reveal exactly how much capital is being lost to inefficient demand patterns.
We're going to break down the specific line items that the utility rarely explains, from the hidden cost of peak-hour windows to the surcharges tied to poor power factors. You'll get a roadmap for reducing those punishing demand charges and the data-backed justification required to invest in infrastructure like BESS or solar carports. This isn't about vague green initiatives; it's about using your own consumption data to build a more profitable, energy-independent facility.
Key Takeaways
- Stop treating your utility statement like a fixed debt. A rigorous business electricity bill analysis turns that opaque document into a diagnostic map for recouping lost capital.
- Learn why the utility cares more about how fast you use power (kW) than how much you use total (kWh), and how that distinction drives those punishing demand charges.
- Spot the "dirty power" penalties and low load factors that are silently inflating your costs through hidden surcharges you've probably been ignoring for years.
- Get the data you need to right-size your infrastructure so you don't waste capital on an oversized solar system that doesn't actually fit your facility's specific load profile.
- Turn your parking lot into a productive asset with solar carports that generate power while physically shielding your property from the California sun (for specialized vehicle and surface care, check out Protek Films).
Table of Contents
- The Anatomy of a California Commercial Power Bill: What the Utility Won’t Explain
- Key Metrics to Track: Load Factor and Power Factor Analysis
- From Analysis to Action: Right-Sizing Your Energy Infrastructure
The Anatomy of a California Commercial Power Bill: What the Utility Won’t Explain
Most commercial utility statements are designed to be paid, not understood. A rigorous business electricity bill analysis is a strategic audit of your consumption, demand, and rate structures. It's the diagnostic tool that separates what you actually use from the grid inefficiencies you're being forced to fund. To fix the bottom line, you have to look at how the utility separates volume from velocity.
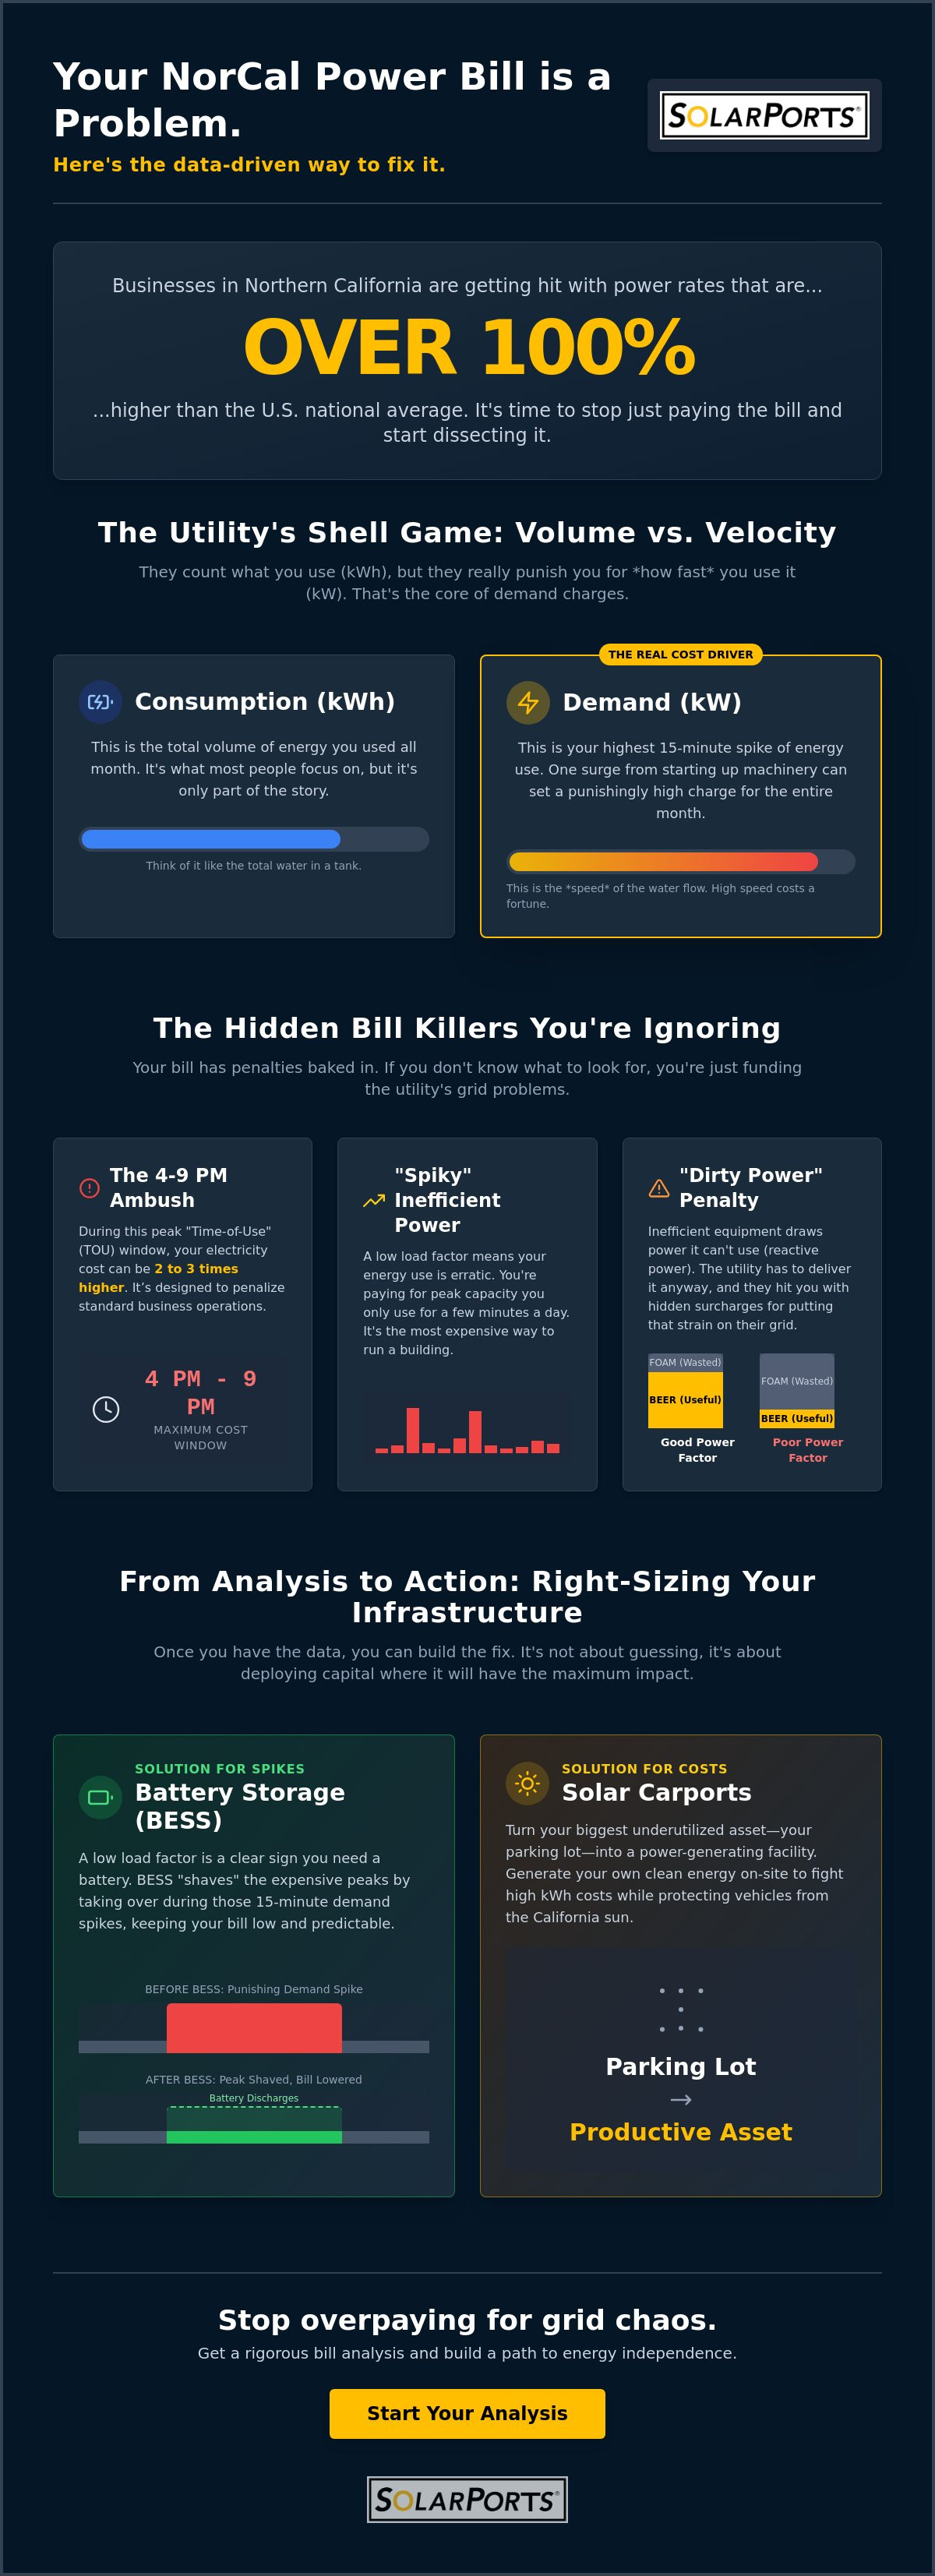
There is a fundamental difference between kWh and kW. kWh measures the total energy consumed over a billing cycle. kW represents the speed or intensity of that usage at any single point in time. If you run ten machines at once for one hour, your kW demand is high; if you run one machine for ten hours, your kWh is the same, but your demand charge is significantly lower. Demand Charges are the utility’s fee for maintaining peak capacity for your equipment. This distinction is critical because utilities like PG&E often penalize the velocity of your power draw more than the total volume.
Effective management requires looking deeper into your Power Factor Analysis to ensure your equipment isn't drawing more current than it actually needs to perform work. When your power factor is low, you're essentially paying for wasted capacity that never hits your production line. It's a hidden surcharge that a surface-level glance at a bill will never reveal. Understanding these granular metrics is the first step toward reclaiming control over your facility's operational costs.
The TOU Trap: Why Your Business Hours Are Costing You Extra
Northern California businesses face some of the most complex Time-of-Use (TOU) schedules in the country. The 4 PM to 9 PM peak window is an operational ROI killer. During these hours, electricity costs can be 2 to 3 times higher than the off-peak rate. It's a system that punishes standard business hours. Your Peak Demand isn't an average of your month. It's usually calculated based on your highest 15-minute usage interval. One surge in equipment activity can dictate a massive portion of your bill. You can find more strategies to lower commercial electricity bills in California that address these specific TOU spikes.
Key Metrics to Track: Load Factor and Power Factor Analysis
Numbers on a utility statement don't tell the whole story until you look at the shape of your energy use. A proper business electricity bill analysis focuses heavily on your load factor. Think of it as a measure of how "smooth" or "spiky" your operations are. If your facility has a low load factor, you're essentially paying for massive peak capacity that you only actually use for a few minutes a day. It's an expensive way to run a building. You're effectively subsidizing the utility's infrastructure for a surge in demand that could likely be managed or shifted.
Then there's the issue of "dirty power." Power factor is a metric that shows how much of the electricity you're pulling is actually doing productive work. Inefficient motors, old HVAC units, and poor lighting ballasts create reactive power. While these issues are common in commercial real estate, they are even more critical in heavy industry; you can discover Super Smart Energy and their specialized energy optimization strategies for the mining and industrial sectors to see how these metrics impact large-scale operations. They'll hit you with hidden surcharges for a poor power factor because it puts unnecessary strain on their grid. If you aren't tracking this, you're leaving money on the table every single month.
You also need to hunt for "vampire loads." These are the systems that stay hum in the background when your building should be dormant. Benchmarking your property against similar commercial assets in Northern California often reveals that 15% to 20% of energy spend happens when nobody is even in the building. It's pure waste.
Load Factor: The Blueprint for Battery Storage
A low load factor is the clearest indicator that your property is a prime candidate for a Battery Energy Storage System (BESS). By using historical interval data, we can predict exactly how many kWh of storage you need to "shave" those expensive peaks. The battery takes over during those 15-minute spikes, keeping your metered demand low and your bill predictable. It's about outsmarting the rate structure rather than just using less light.
Benchmarking and Weather Normalization
Comparing a July bill to a December bill is a fool’s errand in California. You have to account for the heat waves that have become standard. Weather normalization allows you to see if your efficiency measures are actually working or if you're just at the mercy of the thermostat. Setting this realistic baseline is vital before you sign any contracts. If you want to see how your specific data stacks up against current market benchmarks, you can schedule a detailed review of your recent statements to find the outliers.
From Analysis to Action: Right-Sizing Your Energy Infrastructure
You can't sign a contract to make demand charges vanish. While some consultants suggest procurement shifts to lower your per-unit cost, those strategies don't change the hardware reality of your facility's load. A precise business electricity bill analysis is the bridge between auditing and infrastructure. It tells you exactly how much hardware you need to actually alter your property’s financial profile without over-investing in unused capacity.
Building an oversized solar system is just another way to leak capital. If the system size isn't dictated by your specific interval data, you're paying for idle capacity that won't see a return for years. Solar carport systems often provide a better strategic return by converting parking lots into productive assets that physically lower the property's overall load. This ensures a seamless project timeline because the engineering is based on your real-world demand spikes rather than generic estimates. SolarPorts Development operates as the partner that solves the math before we ever consider the construction phase.
The ROI of Data-Driven Infrastructure
The real win is the "avoided cost" of demand fees over a 10-year horizon. Pairing rooftop solar with carports creates a stabilized cash flow that stays resilient against Northern California's frequent rate hikes. You can see how this analysis translated into measurable savings in our recent projects. It's about finding the exact point where generation perfectly offsets your most expensive power draw during those punishing peak windows we discussed earlier.
Your Next Move: The Energy Audit
The process doesn't start with a sales pitch; it starts with 12 months of utility data. A professional energy cost saving analysis should include rate mapping, demand charge reduction plans, and precise hardware sizing. No fluff, just the numbers that justify the move toward energy independence. A bill is a monthly problem, but a data-driven analysis is the solution.
Stop Funding Grid Inefficiency
The utility isn't going to tell you how to lower your bill. That's not their business model. They're incentivized to maintain the status quo while your operational costs climb alongside those 12.9% SCE rate hikes. It's easy to get buried in the spreadsheets, but the reality is simpler than the bill makes it look. You either manage your demand or you pay for the grid's peak capacity. A professional business electricity bill analysis is the only way to move from defensive accounting to strategic investment.
By identifying your load factor and power factor, we can design turnkey solutions that actually fit your facility. Whether it's a Battery Energy Storage System (BESS) to shave peaks or solar carports to reclaim your parking lot, every move we make is backed by the hard ROI of your own usage data. We specialize in California commercial real estate because we know the specific TOU traps that kill profitability. It's time to stop guessing and start building for energy independence.
Ready to see the numbers? Request your custom Commercial Energy Cost Saving Analysis and let's find the capital you're currently losing to the meter. You've got the data; let's put it to work.
Frequently Asked Questions
What is the most important line item on a commercial electricity bill?
Demand charges are almost always the most critical line item because they represent the highest per-unit cost on your statement. While consumption (kWh) tells you the volume of energy used, demand charges (kW) punish you for how fast you use it. In California, these charges can account for 30% to 70% of a total commercial bill. Focusing on this single metric provides the highest leverage for immediate cost reduction.
How much can a business realistically save through bill analysis?
Savings vary by facility type, but a thorough business electricity bill analysis typically uncovers 10% to 20% in immediate operational waste. If the data justifies a hardware shift like BESS or solar carports, the long-term reduction in demand charges can be much more substantial. You aren't just cutting usage; you're restructuring how your property interacts with the grid to avoid the most expensive peak-hour tiers.
Does my business need an engineer to conduct a bill audit?
You don't necessarily need a mechanical engineer, but you do need a specialized energy analyst who understands California's shifting utility tariffs. Most internal accounting teams miss the nuances of Time-of-Use windows and non-bypassable charges. A professional audit isn't about fixing a broken machine; it's about identifying financial inefficiencies in your rate structure and usage patterns that a generalist would likely overlook.
What happens if the analysis shows my building is already efficient?
Efficiency and cost-effectiveness are two different metrics in a regulated market like California. Your building might use very little power, but if that usage hits during a 4 PM to 9 PM peak window, you're still overpaying. The analysis provides a baseline of proof. If you're truly optimized, you'll have the data-backed peace of mind that you're already operating at peak fiscal performance without leaving capital on the table.
Frequently asked questions
The TOU Trap: Why Your Business Hours Are Costing You Extra
Northern California businesses face some of the most complex Time-of-Use (TOU) schedules in the country. The 4 PM to 9 PM peak window is an operational ROI killer. During these hours, electricity costs can be 2 to 3 times higher than the off-peak rate. It's a system that punishes standard business hours. Your Peak Demand isn't an average of your month. It's usually calculated based on your highest 15-minute usage interval. One surge in equipment activity can dictate a massive portion of your bill. You can find more strategies to lower commercial electricity bills in California that address these specific TOU spikes. Numbers on a utility statement don't tell the whole story until you look at the shape of your energy use. A proper business electricity bill analysis focuses heavily on your load factor. Think of it as a measure of how "smooth" or "spiky" your operations are. If your facility has a low load factor, you're essentially paying for massive peak capacity that you only actually use for a few minutes a day. It's an expensive way to run a building. You're effectively subsidizing the utility's infrastructure for a surge in demand that could likely be managed or shifted. Then there's the issue of "dirty power." Power factor is a metric that shows how much of the electricity you're pulling is actually doing productive work. Inefficient motors, old HVAC units, and poor lighting ballasts create reactive power. This doesn't show up as useful energy, but the utility still has to deliver it. They don't do that for free. They'll hit you with hidden surcharges for a poor power factor because it puts unnecessary strain on their grid. If you aren't tracking this, you're leaving money on the table every single month. You also need to hunt for "vampire loads." These are the systems that stay hum in the background when your building should be dormant. Benchmarking your property against similar commercial assets in Northern California often reveals that 15% to 20% of energy spend happens when nobody is even in the building. It's pure waste.
Load Factor: The Blueprint for Battery Storage
A low load factor is the clearest indicator that your property is a prime candidate for a Battery Energy Storage System (BESS). By using historical interval data, we can predict exactly how many kWh of storage you need to "shave" those expensive peaks. The battery takes over during those 15-minute spikes, keeping your metered demand low and your bill predictable. It's about outsmarting the rate structure rather than just using less light.
Benchmarking and Weather Normalization
Comparing a July bill to a December bill is a fool’s errand in California. You have to account for the heat waves that have become standard. Weather normalization allows you to see if your efficiency measures are actually working or if you're just at the mercy of the thermostat. Setting this realistic baseline is vital before you sign any contracts. If you want to see how your specific data stacks up against current market benchmarks, you can schedule a detailed review of your recent statements to find the outliers. You can't sign a contract to make demand charges vanish. While some consultants suggest procurement shifts to lower your per-unit cost, those strategies don't change the hardware reality of your facility's load. A precise business electricity bill analysis is the bridge between auditing and infrastructure. It tells you exactly how much hardware you need to actually alter your property’s financial profile without over-investing in unused capacity. Building an oversized solar system is just another way to leak capital. If the system size isn't dictated by your specific interval data, you're paying for idle capacity that won't see a return for years. Solar carport systems often provide a better strategic return by converting parking lots into productive assets that physically lower the property's overall load. This ensures a seamless project timeline because the engineering is based on your real-world demand spikes rather than generic estimates. SolarPorts Development operates as the partner that solves the math before we ever consider the construction phase.
The ROI of Data-Driven Infrastructure
The real win is the "avoided cost" of demand fees over a 10-year horizon. Pairing rooftop solar with carports creates a stabilized cash flow that stays resilient against Northern California's frequent rate hikes. You can see how this analysis translated into measurable savings in our recent projects. It's about finding the exact point where generation perfectly offsets your most expensive power draw during those punishing peak windows we discussed earlier.
Your Next Move: The Energy Audit
The process doesn't start with a sales pitch; it starts with 12 months of utility data. A professional energy cost saving analysis should include rate mapping, demand charge reduction plans, and precise hardware sizing. No fluff, just the numbers that justify the move toward energy independence. A bill is a monthly problem, but a data-driven analysis is the solution. The utility isn't going to tell you how to lower your bill. That's not their business model. They're incentivized to maintain the status quo while your operational costs climb alongside those 12.9% SCE rate hikes. It's easy to get buried in the spreadsheets, but the reality is simpler than the bill makes it look. You either manage your demand or you pay for the grid's peak capacity. A professional business electricity bill analysis is the only way to move from defensive accounting to strategic investment. By identifying your load factor and power factor, we can design turnkey solutions that actually fit your facility. Whether it's a Battery Energy Storage System (BESS) to shave peaks or solar carports to reclaim your parking lot, every move we make is backed by the hard ROI of your own usage data. We specialize in California commercial real estate because we know the specific TOU traps that kill profitability. It's time to stop guessing and start building for energy independence. Ready to see the numbers? Request your custom Commercial Energy Cost Saving Analysis and let's find the capital you're currently losing to the meter. You've got the data; let's put it to work.
What is the most important line item on a commercial electricity bill?
Demand charges are almost always the most critical line item because they represent the highest per-unit cost on your statement. While consumption (kWh) tells you the volume of energy used, demand charges (kW) punish you for how fast you use it. In California, these charges can account for 30% to 70% of a total commercial bill. Focusing on this single metric provides the highest leverage for immediate cost reduction.
How much can a business realistically save through bill analysis?
Savings vary by facility type, but a thorough business electricity bill analysis typically uncovers 10% to 20% in immediate operational waste. If the data justifies a hardware shift like BESS or solar carports, the long-term reduction in demand charges can be much more substantial. You aren't just cutting usage; you're restructuring how your property interacts with the grid to avoid the most expensive peak-hour tiers.
Does my business need an engineer to conduct a bill audit?
You don't necessarily need a mechanical engineer, but you do need a specialized energy analyst who understands California's shifting utility tariffs. Most internal accounting teams miss the nuances of Time-of-Use windows and non-bypassable charges. A professional audit isn't about fixing a broken machine; it's about identifying financial inefficiencies in your rate structure and usage patterns that a generalist would likely overlook.
What happens if the analysis shows my building is already efficient?
Efficiency and cost-effectiveness are two different metrics in a regulated market like California. Your building might use very little power, but if that usage hits during a 4 PM to 9 PM peak window, you're still overpaying. The analysis provides a baseline of proof. If you're truly optimized, you'll have the data-backed peace of mind that you're already operating at peak fiscal performance without leaving capital on the table.