Commercial Energy Usage Analysis California: Finding the Signal in the Utility Noise

Most California business owners look at their PG&E or SCE bills and see a figure they can't explain, let alone control. It's a common frustration. You're likely staring at demand charges that swallow 50% of your monthly statement while trying to make sense of shifting Time-of-Use windows that keep the goalposts moving. To stop the bleeding, you need a commercial energy usage analysis California that moves past the summary page and into granular interval data. It's the only way to find the signal in the noise.
The reality is that your monthly bill is a post-mortem, not a strategy. We're going to show you how to map peak usage times with precision and build a rock-solid financial justification for BESS or solar carports. By the end of this, you'll have a data-driven map to lower your operational expenses and take the teeth out of the next rate hike. You'll stop guessing at your utility costs and start treating energy as a manageable asset that responds to logic rather than luck.
Key Takeaways
- Stop letting a single 15-minute spike ruin your monthly budget. You'll learn how to identify the demand charges that often account for half of your total utility cost.
- Get your hands on "Green Button" interval data. This granular look at your 15-minute usage is the only way to move past the utility's opaque summary page and see the real story.
- Use a commercial energy usage analysis California to map your specific load profile against complex rate schedules like PG&E’s B-19 or B-20 to find the most favorable terms.
- Transition from analysis to action by right-sizing BESS and solar carports. These assets don't just generate power; they act as financial tools to "shave" peak demand automatically.
Table of Contents
- The California Utility Trap: Why Your Monthly Bill Hides the Real Costs
- Conducting a Strategic Energy Analysis: Beyond the Utility Bill
- From Analysis to Assets: Right-Sizing BESS and Solar Carports
The California Utility Trap: Why Your Monthly Bill Hides the Real Costs
Your monthly statement is a summary of past failures, not a roadmap for future savings. Most property owners look at the total due and move on, but that's exactly what the utilities want. A real commercial energy usage analysis California isn't a casual review of your meter. It's a forensic investigation into Time-of-Use (TOU) windows and the specific demand peaks that drive your costs skyward. In the complex California energy landscape, electricity isn't priced by what you use over thirty days. It's priced by the most stressful fifteen minutes your property puts on the grid.
The urgency here is unique. While businesses in more stable states deal with predictable, flat rates, California is a volatile market defined by extreme pricing swings. The goal isn't just "saving energy" in a general sense. It's about load shifting. You want to move your heaviest electrical burdens away from the hours when the utility is most desperate for power. If you don't have a plan to move that load, you're essentially volunteering to pay a premium for the exact same product your competitors are getting cheaper.
Decoding California Demand Charges
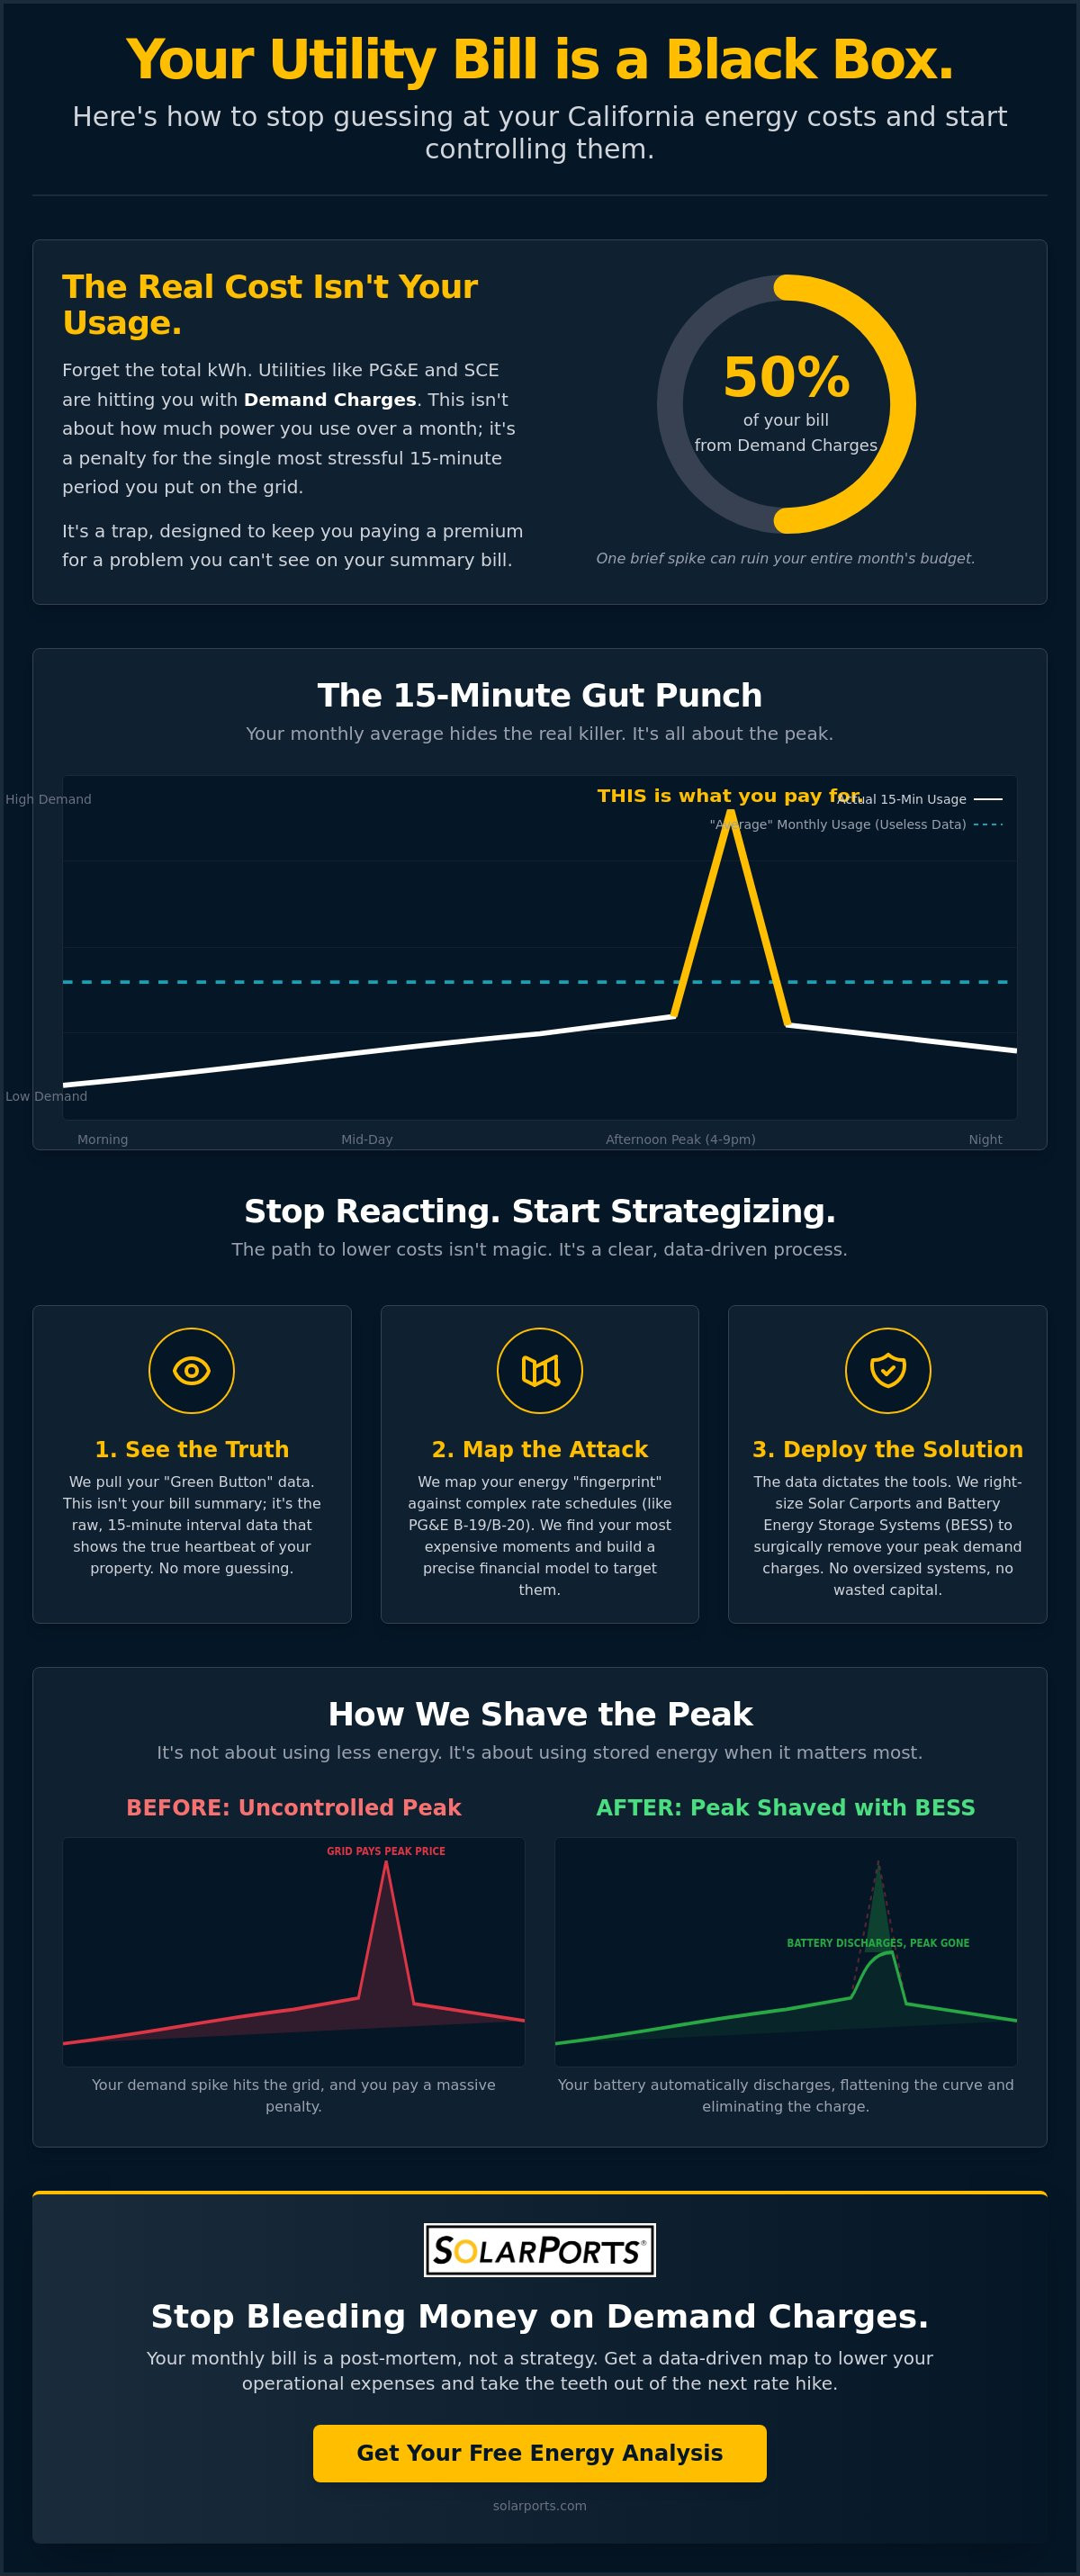
Utilities like PG&E and SCE don't just bill for electrons. They bill for the "readiness to serve." If your HVAC kicks on at the same moment your elevators move during a 4:00 p.m. to 9:00 p.m. TOU window, you've set a new peak. That single 15-minute spike can account for up to 50% of your entire bill. It's a penalty for lack of foresight. Without a strategy for load shifting, you're just writing the utility a blank check every month.
The Problem with "Average" Usage Data
A generic energy audit is usually a waste of time because it looks at averages. Averages are comfortable, but they're dangerous. They smooth out the very spikes that make BESS or solar carports financially viable. You can't justify a capital investment based on a monthly total. You need the granular, "Green Button" data that shows exactly when your building is bleeding money. Only then can you stop reacting to rate hikes and start outmaneuvering them.
This forensic approach to data mirrors the digital transformation seen in other enterprise sectors; for example, global enterprises utilize Computer Market Research to streamline and automate their channel management processes.
Conducting a Strategic Energy Analysis: Beyond the Utility Bill
Efficiency is often sold as a volume game, but in California, it's a timing game. To win, you have to move past the monthly summary. A real commercial energy usage analysis California starts with your "Green Button" data. This is the raw, 15-minute interval data that reveals the true heartbeat of your property. Without it, you're just guessing at why your bill is high. You're looking at a total when you should be looking at a timeline.
Once you have this data, you can map it against specific utility rate schedules like PG&E’s B-19 or B-20. This allows you to identify which loads are non-discretionary, like essential cooling, and which are discretionary. The California Commercial End-Use Survey provides a solid baseline for how different building types consume power, but your specific "fingerprint" is what determines your ROI on behind-the-meter assets. You can't model a battery system on a monthly average any more than you can plan a commute based on an annual mileage total.
The Power of 15-Minute Interval Data
Interval data is the essential DNA for right-sizing solar carports and BESS. It shows the exact moment your HVAC or heavy machinery creates a demand spike. If you build a system based on monthly averages, you'll likely undersize the battery or oversize the solar array. We use these data-driven assessments to ensure every kilowatt of capacity is working to offset your most expensive 15-minute windows.
Mapping Your Energy Exit Strategy
There's a common misconception that energy analysis is just about buying new lightbulbs or upgrading windows. Those are fine, but they don't solve the demand charge problem. A strategic exit from high utility costs focuses on peak shaving. It’s about using stored energy to "shave" the top off those expensive spikes without changing how you run your business. If you're ready to stop the guesswork, schedule a forensic review of your interval data to see where the real savings are hidden.
From Analysis to Assets: Right-Sizing BESS and Solar Carports
Data is just numbers on a screen until you turn it into steel and silicon on your property. A commercial energy usage analysis California should lead directly to assets that move the needle on your OpEx. The real trick is right-sizing. If you over-build, your ROI stretches out for decades. If you under-build, you still get hit with those 15-minute demand spikes that ruin your budget. While national commercial energy consumption data gives a broad look at how buildings operate, your specific interval data tells us exactly how much battery capacity you need to stay under the utility's radar.
Mitigating Demand Charges with BESS
Batteries are the ultimate defense against the 15-minute peak. By discharging during the most expensive Time-of-Use windows, a Battery Energy Storage System (BESS) protects your bottom line automatically. It’s not about going off-grid. It’s about surgical strikes against the utility’s pricing structure. You can see how this works in practice by looking at various SolarPorts projects where storage and solar work in tandem to flatten the load profile and keep costs predictable.
The Strategic Value of Solar Carports
Solar carports often outperform rooftop systems, especially for older commercial buildings where roof integrity is a liability. You’re turning existing parking lot asphalt into a power plant. This adds tangible property value while shielding vehicles from the sun. It's a cleaner way to deploy assets without the headaches of roof penetrations or structural reinforcements. For a deeper dive into the math, check out our Commercial Solar ROI Analysis or explore other Strategies to Lower Commercial Electricity Bills in California.
In Northern California, this isn't just about the bill. It's about resilience. With Public Safety Power Shutoff (PSPS) risks becoming a seasonal reality, having on-site generation and storage is a business continuity requirement. Just as SpaceCenter Systems helps businesses maintain a robust digital presence and infrastructure, a thorough commercial energy usage analysis California accounts for these outages. It transforms energy from a volatile monthly expense into a controlled, reliable asset that keeps your doors open when the local grid fails.
Take Control of Your Operational Expenses
The utility bill is a blunt instrument designed to keep you on the defensive. You've seen how 15-minute demand spikes can hijack your OpEx and why "average" data is a trap that leads to poorly sized equipment. True efficiency in California isn't about general conservation. It's about a surgical approach to load shifting. A precise commercial energy usage analysis California is the first step toward reclaiming your budget and turning a volatile liability into a stable, predictable asset.
We specialize in the California commercial real estate market, providing turnkey implementation for BESS and solar carports with a relentless focus on 15-minute interval data precision. You don't need a generic audit. You need a financial architect for your building’s energy profile who understands the granular nuances of this market. It's time to stop letting the grid dictate your margins and start treating energy as the manageable resource it actually is.
Get a data-driven energy cost saving analysis for your property to see the actual savings hidden in your utility noise. The data is there. It's time you used it to your advantage.
Frequently Asked Questions
What is the difference between an energy audit and a commercial energy usage analysis?
An energy audit is a physical inspection of hardware like lightbulbs and insulation, while a commercial energy usage analysis California is a forensic study of your 15-minute interval data. Audits tell you what is using power; analysis tells you when it’s happening. Understanding the timing is what allows you to target demand charges and Time-of-Use windows, which is where the real financial relief lives for property owners.
How do I get my 15-minute interval data from my California utility?
You can download this data through your utility’s online portal using the "Green Button" feature. Most major providers like PG&E, SCE, and SDG&E allow you to export your usage in 15-minute increments as a CSV or XML file. If you find the portal navigation frustrating, you can authorize a third party to pull this data directly through a standardized "Share My Data" request, which is often faster and more reliable.
Can an energy analysis help me avoid PG&E demand charges?
Yes, it works by pinpointing the specific 15-minute spikes that trigger those charges. Once the analysis identifies these peaks, you can deploy a Battery Energy Storage System (BESS) to discharge power during those exact moments. This "shaves" the peak seen by the utility, effectively lowering the demand charge without requiring you to shut down essential machinery or HVAC systems during your busiest hours.
How long does a professional energy cost-saving analysis typically take for a commercial property?
A thorough commercial energy usage analysis California usually takes between two and four weeks once the interval data is secured. The actual data crunching is fast, but mapping those results against complex tariff schedules and modeling different asset configurations like solar carports takes time. It's a detailed piece of work that shouldn't be rushed if you're looking for a solid financial justification for a capital investment.
Frequently asked questions
Decoding California Demand Charges
Utilities like PG&E and SCE don't just bill for electrons. They bill for the "readiness to serve." If your HVAC kicks on at the same moment your elevators move during a 4:00 p.m. to 9:00 p.m. TOU window, you've set a new peak. That single 15-minute spike can account for up to 50% of your entire bill. It's a penalty for lack of foresight. Without a strategy for load shifting, you're just writing the utility a blank check every month.
The Problem with "Average" Usage Data
A generic energy audit is usually a waste of time because it looks at averages. Averages are comfortable, but they're dangerous. They smooth out the very spikes that make BESS or solar carports financially viable. You can't justify a capital investment based on a monthly total. You need the granular, "Green Button" data that shows exactly when your building is bleeding money. Only then can you stop reacting to rate hikes and start outmaneuvering them. Efficiency is often sold as a volume game, but in California, it's a timing game. To win, you have to move past the monthly summary. A real commercial energy usage analysis California starts with your "Green Button" data. This is the raw, 15-minute interval data that reveals the true heartbeat of your property. Without it, you're just guessing at why your bill is high. You're looking at a total when you should be looking at a timeline. Once you have this data, you can map it against specific utility rate schedules like PG&E’s B-19 or B-20. This allows you to identify which loads are non-discretionary, like essential cooling, and which are discretionary. The California Commercial End-Use Survey provides a solid baseline for how different building types consume power, but your specific "fingerprint" is what determines your ROI on behind-the-meter assets. You can't model a battery system on a monthly average any more than you can plan a commute based on an annual mileage total.
The Power of 15-Minute Interval Data
Interval data is the essential DNA for right-sizing solar carports and BESS. It shows the exact moment your HVAC or heavy machinery creates a demand spike. If you build a system based on monthly averages, you'll likely undersize the battery or oversize the solar array. We use these data-driven assessments to ensure every kilowatt of capacity is working to offset your most expensive 15-minute windows.
Mapping Your Energy Exit Strategy
There's a common misconception that energy analysis is just about buying new lightbulbs or upgrading windows. Those are fine, but they don't solve the demand charge problem. A strategic exit from high utility costs focuses on peak shaving. It’s about using stored energy to "shave" the top off those expensive spikes without changing how you run your business. If you're ready to stop the guesswork, schedule a forensic review of your interval data to see where the real savings are hidden. Data is just numbers on a screen until you turn it into steel and silicon on your property. A commercial energy usage analysis California should lead directly to assets that move the needle on your OpEx. The real trick is right-sizing. If you over-build, your ROI stretches out for decades. If you under-build, you still get hit with those 15-minute demand spikes that ruin your budget. While national commercial energy consumption data gives a broad look at how buildings operate, your specific interval data tells us exactly how much battery capacity you need to stay under the utility's radar.
Mitigating Demand Charges with BESS
Batteries are the ultimate defense against the 15-minute peak. By discharging during the most expensive Time-of-Use windows, a Battery Energy Storage System (BESS) protects your bottom line automatically. It’s not about going off-grid. It’s about surgical strikes against the utility’s pricing structure. You can see how this works in practice by looking at various SolarPorts projects where storage and solar work in tandem to flatten the load profile and keep costs predictable.
The Strategic Value of Solar Carports
Solar carports often outperform rooftop systems, especially for older commercial buildings where roof integrity is a liability. You’re turning existing parking lot asphalt into a power plant. This adds tangible property value while shielding vehicles from the sun. It's a cleaner way to deploy assets without the headaches of roof penetrations or structural reinforcements. For a deeper dive into the math, check out our Commercial Solar ROI Analysis or explore other Strategies to Lower Commercial Electricity Bills in California. In Northern California, this isn't just about the bill. It's about resilience. With Public Safety Power Shutoff (PSPS) risks becoming a seasonal reality, having on-site generation and storage is a business continuity requirement. A thorough commercial energy usage analysis California accounts for these outages. It transforms energy from a volatile monthly expense into a controlled, reliable asset that keeps your doors open when the local grid fails. The utility bill is a blunt instrument designed to keep you on the defensive. You've seen how 15-minute demand spikes can hijack your OpEx and why "average" data is a trap that leads to poorly sized equipment. True efficiency in California isn't about general conservation. It's about a surgical approach to load shifting. A precise commercial energy usage analysis California is the first step toward reclaiming your budget and turning a volatile liability into a stable, predictable asset. We specialize in the California commercial real estate market, providing turnkey implementation for BESS and solar carports with a relentless focus on 15-minute interval data precision. You don't need a generic audit. You need a financial architect for your building’s energy profile who understands the granular nuances of this market. It's time to stop letting the grid dictate your margins and start treating energy as the manageable resource it actually is. Get a data-driven energy cost saving analysis for your property to see the actual savings hidden in your utility noise. The data is there. It's time you used it to your advantage.
What is the difference between an energy audit and a commercial energy usage analysis?
An energy audit is a physical inspection of hardware like lightbulbs and insulation, while a commercial energy usage analysis California is a forensic study of your 15-minute interval data. Audits tell you what is using power; analysis tells you when it’s happening. Understanding the timing is what allows you to target demand charges and Time-of-Use windows, which is where the real financial relief lives for property owners.
How do I get my 15-minute interval data from my California utility?
You can download this data through your utility’s online portal using the "Green Button" feature. Most major providers like PG&E, SCE, and SDG&E allow you to export your usage in 15-minute increments as a CSV or XML file. If you find the portal navigation frustrating, you can authorize a third party to pull this data directly through a standardized "Share My Data" request, which is often faster and more reliable.
Can an energy analysis help me avoid PG&E demand charges?
Yes, it works by pinpointing the specific 15-minute spikes that trigger those charges. Once the analysis identifies these peaks, you can deploy a Battery Energy Storage System (BESS) to discharge power during those exact moments. This "shaves" the peak seen by the utility, effectively lowering the demand charge without requiring you to shut down essential machinery or HVAC systems during your busiest hours.
How long does a professional energy cost-saving analysis typically take for a commercial property?
A thorough commercial energy usage analysis California usually takes between two and four weeks once the interval data is secured. The actual data crunching is fast, but mapping those results against complex tariff schedules and modeling different asset configurations like solar carports takes time. It's a detailed piece of work that shouldn't be rushed if you're looking for a solid financial justification for a capital investment.