
Business Electricity Bill Analysis: The Unfiltered 2026 Blueprint for CA Property Owners

Most California property owners are essentially writing a blank check to their utility provider every month because the bill is designed to be unreadable. It's exhausting to watch your overhead climb while you're stuck in a complex web of Time-of-Use rates and demand charges that feel like a moving target. You probably already know that Southern California Edison rates have jumped over 9% annually since 2018, but simply seeing the numbers doesn't tell you how to stop them. A forensic business electricity bill analysis is the first step toward taking that control back. We're stripping away the fluff to show you exactly how raw data dictates your financial strategy. This guide breaks down the 2026 rate landscape, explains why demand ratchets are killing your margins, and provides a clear roadmap for using solar and BESS to lock in permanent operational savings.
Key Takeaways
- Stop looking at the total amount due; the real financial leaks are buried in demand charges and peak-hour multipliers you probably ignore.
- You need 12 months of granular "Green Button" interval data to see your building's true energy profile at 15-minute increments.
- A professional business electricity bill analysis serves as a structural blueprint, identifying exactly which hardware response will actually fix your specific data problem.
- Implementing BESS or solar carports isn't just about "going green"; it's a strategic move to shave peak demand and insulate your bottom line from utility monopolies.
Table of Contents
- Beyond the Bottom Line: What Your Utility Bill Is Actually Hiding
- The Blueprint: 5 Steps to a Strategic Business Electricity Bill Analysis
- From Data to Infrastructure: Executing the Savings Strategy
Beyond the Bottom Line: What Your Utility Bill Is Actually Hiding
Your monthly utility bill is a carefully constructed piece of fiction. While you're focused on the total amount due at the bottom, the real financial story is buried in the line items you've likely been trained to ignore. A proper business electricity bill analysis reveals that looking for simple accounting errors is usually a waste of time. You aren't being overcharged because of a typo; you're being drained by a power profile that doesn't match the grid's current reality.
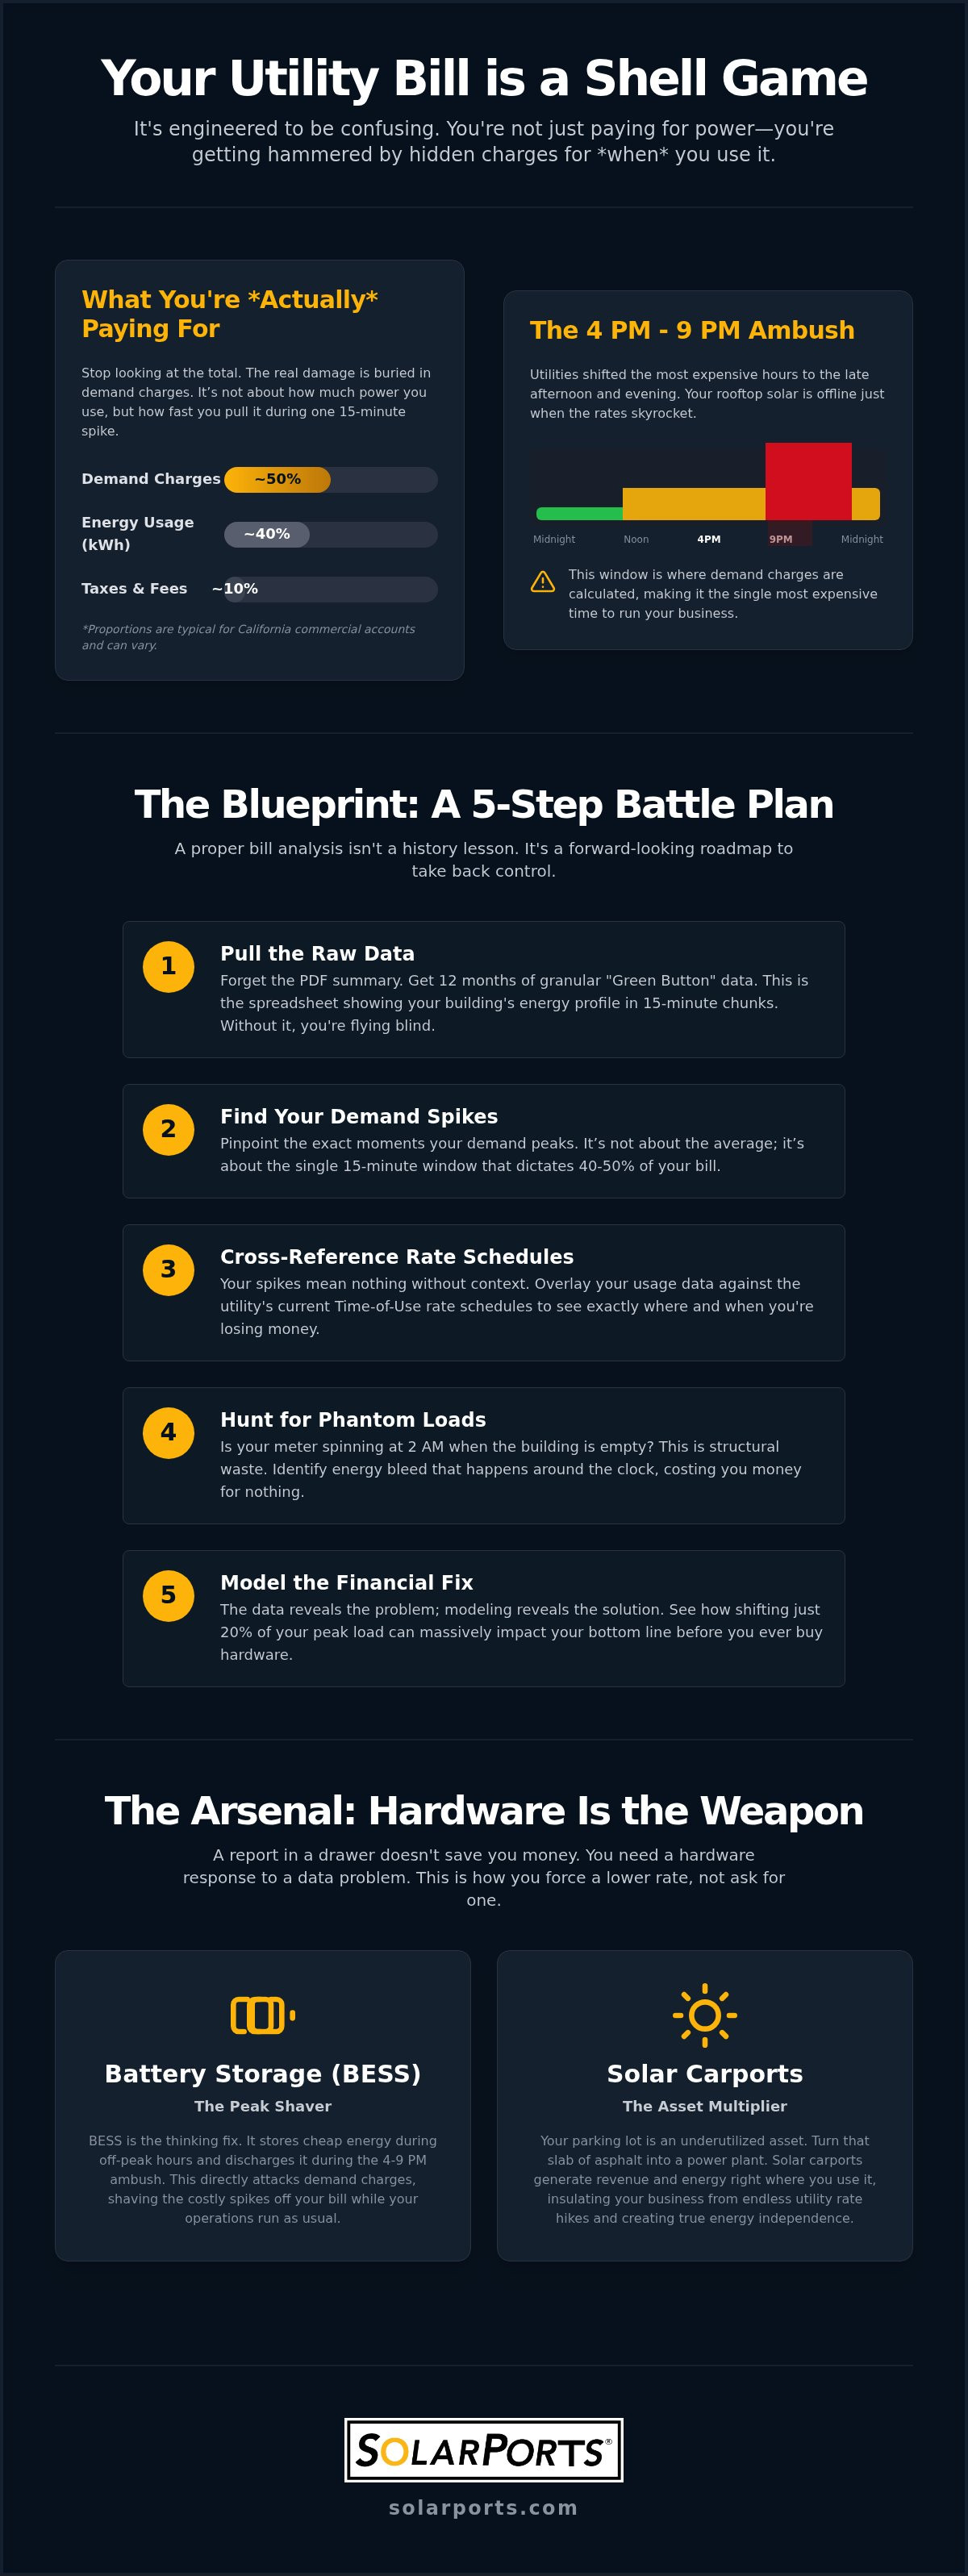
Most owners treat electricity like water, paying for the total volume consumed. But commercial electricity rate structures in California prioritize demand; specifically, the speed at which you pull energy from the grid. Think of it as a pipe. The utility doesn't just charge you for the water you drink. They charge you for the size of the pipe they had to build to handle your thirstiest 15 minutes. That single spike often dictates 40% of your monthly commercial bill, making a forensic business electricity bill analysis the only way to identify where the bleeding starts.
The California Demand Charge Trap
Utilities like PG&E and SCE have aggressively shifted on-peak hours to the 4:00 PM to 9:00 PM window. This move makes traditional conservation, like switching to LED bulbs, almost irrelevant to your bottom line because those savings don't hit when the rates are highest. You might have rooftop solar, but if it's producing at noon when rates are low, it won't help you when the demand ratchet kicks in later. You need targeted strategies to lower commercial electricity bills California owners can actually use to decouple operations from these expensive peak windows.
The Blueprint: 5 Steps to a Strategic Business Electricity Bill Analysis
Execution requires precision. A high-level audit is just a history lesson; a strategic business electricity bill analysis is a forward-looking roadmap. Start by pulling 12 months of 'Green Button' interval data. This isn't your standard PDF summary. It's a granular spreadsheet showing exactly what's happening in your building every 15 minutes. Without this level of detail, you're just guessing at the cause of your costs.
Once you have the data, cross-reference your usage spikes against current 2026 utility rate schedules. Many California Time-of-Use plans have shifted peak windows so late that traditional solar alone can't keep up with the highest charges. You also need to hunt for the 'phantom load.' If your meters are spinning at 2 AM when the facility is empty, you're paying for structural waste that no amount of solar will fix. Modeling a shift of just 20% of your peak load to off-peak hours often reveals a massive swing in operational profitability. If you want to see how these numbers look for your specific site, you can book a preliminary data review to get started.
Deciphering Your Interval Data
A monthly summary is useless for a CFO. If you're planning a 20-year infrastructure investment, you need to know exactly when your demand peaks occur, not just how high they were. We use this interval data to 'right-size' every component. Overbuilding solar is a common trap that kills ROI; conversely, under-sizing a BESS leaves you exposed to demand charges. A comprehensive commercial property energy cost saving analysis ensures the hardware response matches the data reality. It's about building exactly what you need, not what a salesperson wants to move.
From Data to Infrastructure: Executing the Savings Strategy
A report sitting in a drawer doesn't pay the bills. If your business electricity bill analysis shows a massive demand spike every afternoon, you can't just ask your tenants to turn off the air conditioning. You need a hardware response to a data problem. Negotiating a utility contract might save a few pennies, but it won't stop the demand charges that make up half your bill. Battery Energy Storage Systems (BESS) act as a "thinking fix" for these issues. They discharge during those expensive windows, shaving your peaks while your operations continue exactly as usual. It's the difference between hoping for a lower rate and forcing one through strategic infrastructure.
Solar carports represent the next logical step in this evolution. Instead of letting your parking lot sit as an underutilized slab of asphalt, you turn it into a revenue-generating asset. These systems shield your property from the utility's frequent rate hikes by generating power right where it's used. The ultimate goal of a forensic business electricity bill analysis is taking control of both the generation and the storage to achieve true energy independence. You're no longer just a customer; you're a producer. For those evaluating the market value of their hospitality assets on the Restaurant For Sale Marketplace, this level of operational efficiency can significantly enhance a property's appeal to potential buyers.
Why BESS and Solar Carports are the Logical Conclusion
BESS provides the resiliency California businesses need in an increasingly unstable grid. It's not just about the immediate savings; it's about keeping the lights on when the grid fluctuates or the utility implements rolling blackouts. Solar carports offer a clear double-win by providing covered parking for tenants while driving down property-wide operational overhead. When you look at a commercial solar ROI analysis, the integration of carports and storage consistently shows the strongest long-term fiscal performance for small-scale commercial real estate. This isn't just about "going green." It's a calculated financial move to stabilize your building's most volatile operating expense.
Take Control of Your Energy Future
Utility providers are counting on you staying confused by the complex line items on your statement. But you've seen that a forensic business electricity bill analysis is the only real way to stop the financial bleeding. By identifying those aggressive 15-minute demand spikes and right-sizing infrastructure like BESS and solar carports, you're building a structural shield against future rate hikes. We provide turnkey California solutions backed by precise ROI modeling so you aren't guessing at the outcome. Don't let another month of unpredictable overhead erode your property's value. It's time to stop paying for the utility's inefficiency and start investing in your own operational resiliency. Request your data-driven Commercial Energy Cost Saving Analysis to see the real numbers for your site. You're ready to make the switch.
Frequently Asked Questions
What is the difference between an energy audit and a bill analysis?
An energy audit looks at your hardware, like bulbs and HVAC units, while a business electricity bill analysis examines your financial relationship with the grid. It's the difference between checking for a leaky faucet and checking if you're being billed for the wrong meter class. One fixes consumption; the other fixes the rate and demand structure that actually dictates your monthly overhead.
How much can a California business actually save through bill analysis?
Savings vary based on your specific load profile, but addressing demand charges can often reduce a commercial bill by 20% to 40%. Since Southern California Edison rates have seen annual increases of 9.2% since 2018, the goal isn't just a one-time discount. It's about building a structural defense that keeps those recurring utility hikes from eating your entire operational margin.
Do I need to change my utility provider to lower my bill?
No, and in most parts of California, you realistically can't. While programs like Community Choice Aggregation (CCA) exist, they only change who buys the power, not how the utility charges you for delivery. A professional business electricity bill analysis focuses on changing how your building interacts with the existing grid, using on-site hardware to bypass the utility's most expensive windows.
How long does a professional energy cost saving analysis take?
The initial data gathering takes minutes once you have access to your utility portal. A comprehensive forensic review typically takes about one to two weeks to model. This timeline allows for a deep dive into 12 months of interval data to ensure any proposed hardware, like a BESS or solar carport, is right-sized for your actual 15-minute peak usage patterns.
What data do I need to provide for a commercial energy analysis?
You need to provide 12 months of "Green Button" interval data and your most recent complete utility statement. This data reveals the granular 15-minute usage spikes that a standard summary bill hides. We use this to map your consumption against current 2026 rate schedules, identifying exactly where demand ratchets are being triggered and how to strategically mitigate them.
Frequently asked questions
What is the difference between an energy audit and a bill analysis?
An energy audit looks at your hardware, like bulbs and HVAC units, while a business electricity bill analysis examines your financial relationship with the grid. It's the difference between checking for a leaky faucet and checking if you're being billed for the wrong meter class. One fixes consumption; the other fixes the rate and demand structure that actually dictates your monthly overhead.
How much can a California business actually save through bill analysis?
Savings vary based on your specific load profile, but addressing demand charges can often reduce a commercial bill by 20% to 40%. Since Southern California Edison rates have seen annual increases of 9.2% since 2018, the goal isn't just a one-time discount. It's about building a structural defense that keeps those recurring utility hikes from eating your entire operational margin.
Do I need to change my utility provider to lower my bill?
No, and in most parts of California, you realistically can't. While programs like Community Choice Aggregation (CCA) exist, they only change who buys the power, not how the utility charges you for delivery. A professional business electricity bill analysis focuses on changing how your building interacts with the existing grid, using on-site hardware to bypass the utility's most expensive windows.
How long does a professional energy cost saving analysis take?
The initial data gathering takes minutes once you have access to your utility portal. A comprehensive forensic review typically takes about one to two weeks to model. This timeline allows for a deep dive into 12 months of interval data to ensure any proposed hardware, like a BESS or solar carport, is right-sized for your actual 15-minute peak usage patterns.
What data do I need to provide for a commercial energy analysis?
You need to provide 12 months of "Green Button" interval data and your most recent complete utility statement. This data reveals the granular 15-minute usage spikes that a standard summary bill hides. We use this to map your consumption against current 2026 rate schedules, identifying exactly where demand ratchets are being triggered and how to strategically mitigate them.